


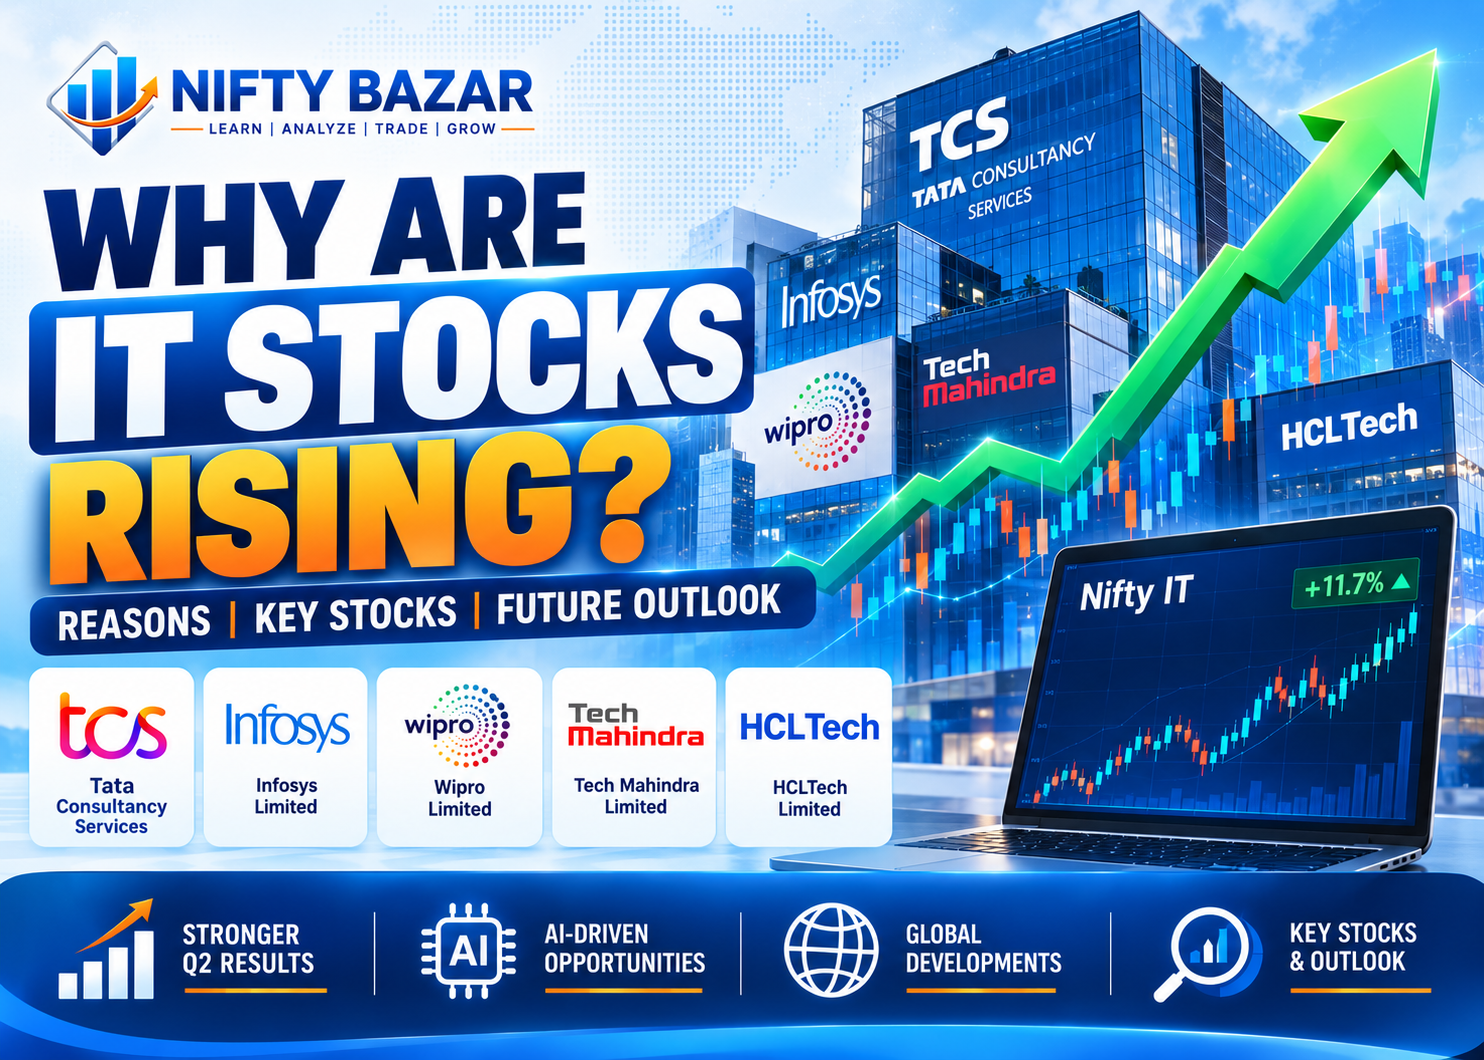
Why Are IT Stocks Rising in October 2026? TCS, Wipro, Tech Mahindra & Infosys Outlook
Discover why Indian IT stocks are rallying, what is driving the latest movement in TCS, Wipro, Tech Mahindra, Infosys and HCLTech, and whether the recovery can continue.
Indian IT stocks are rallying in October 2026. Discover why TCS, Wipro, Tech Mahindra and Infosys are rising and whether the recovery can continue.
IT SECTOR
Why Are Indian IT Stocks Rallying in October 2026? TCS, Wipro, Tech Mahindra & Infosys Outlook
Understand the sudden rally in Indian IT stocks, the role of Q2 earnings and AI-related global developments, and whether the Nifty IT rally can continue or reverse.
NIFTY BAZAR DESK · Published 16 Oct 2026

Indian IT stocks have attracted strong buying after a prolonged period of weakness.
NIFTY IT — WEEK TO 16 OCT +11.7% Best week in ~18 years | STILL DOWN FOR THE YEAR ~−16% Despite the rebound | 13 OCT SINGLE-DAY MOVE +5.22% Nifty IT closed 29,830 |
Indian IT stocks have seen a sharp recovery in October 2026. Companies such as TCS, Wipro, Tech Mahindra, Infosys and HCLTech have attracted strong buying interest after a long stretch of weakness.
The Nifty IT index gained around 11.7% in the week ending 16 October 2026 — its strongest weekly advance in roughly 18 years, according to Reuters — yet it's still down around 16% for the year. On 13 October alone, the index closed up 5.22% at 29,830, led by HCLTech (+8.42%), TCS (+6.79%) and Tech Mahindra (+4.93%).
Is this the start of a new uptrend — or could IT stocks fall again?
1. Why Are IT Stocks Suddenly Rising?
01
Stronger-than-expected quarterly results
Investors feared weak technology spending, slow client decisions and AI-related uncertainty. But the September-quarter results from several large IT companies were better than feared, pushing investors to reconsider stocks that had already fallen sharply. When results beat expectations, a stock can rise even if underlying growth isn't exceptional.
02
Heavy selling created a rebound opportunity
After steep declines, some investors hunt for lower valuations. If results reassure, short covering and fresh buying can combine to accelerate a recovery. But a sharp rebound after a long fall doesn't automatically mean the long-term downtrend has ended.
03
Global AI stocks came under pressure
Worries over high AI infrastructure costs, expensive valuations and the profitability of huge investments led investors to reassess some global tech names — and some rotated toward established Indian IT services businesses. That's a shift in preference, not proof that AI-related risks for Indian IT have disappeared.
04
Expectations around AI-led revenue
Indian IT firms are investing in AI services, automation and enterprise transformation. Investors want proof that AI creates new revenue rather than just reducing demand for traditional outsourcing. Management commentary has lifted sentiment, but the real test is revenue growth, margins and client spending.

The long-term impact of AI on IT services will depend on actual revenue growth, margins and client spending.
2. Important IT Stocks to Watch
| Stock | Why It Matters | What to Watch |
|---|---|---|
| TCS | One of India's largest IT services companies; its results, deal pipeline and AI opportunities set the sector tone. | Revenue growth, operating margins, new deal wins, management guidance |
| Infosys | Large international client base and exposure to enterprise technology spending. | Revenue guidance, large deals, discretionary spending, US/Europe demand |
| HCLTech | Exposure to IT services, engineering & R&D services and software products; guidance can move sector sentiment. | Services growth, software performance, margins, AI-related demand |
| Tech Mahindra | Significant telecom and enterprise tech exposure; latest quarter drew a positive market response, with revenue beating expectations and deal wins supporting sentiment. | Telecom spending, deal wins, revenue growth, margin improvement |
Revenue was broadly in line with expectations and operating margins improved. But deal bookings weakened and the December-quarter revenue outlook remained soft.
TOTAL DEAL BOOKINGS −22.9% QoQ to $2.6 billion | LARGE DEAL BOOKINGS −58.6% to $700 million |
What to watch: whether deal bookings recover and whether AI-related services turn into measurable revenue growth. For context, see Wipro's previous-quarter (Q1 FY27) results.
Other IT stocks on the radar
- Persistent Systems — digital engineering, software services and AI-related demand
- Coforge — deal wins, client spending and revenue growth
- LTIMindtree — large transformation projects, margins and client demand
- Mphasis — banking, financial services and enterprise technology spending
- Oracle Financial Services Software — banking technology demand and software performance
These stocks can react differently to the same sector rally. Evaluate each company's results, valuation and price trend independently instead of assuming all IT stocks will rise together.
3. Will the IT Rally Continue or Reverse?
There are three possible scenarios.
Healthy earnings, improving deal wins and supportive global tech spending could extend the recovery. A sustained uptrend looks more convincing if stocks keep making higher highs and higher lows, break key resistance levels and get volume support.
After a sharp rally, profit booking is natural and prices could drift sideways while the market digests earnings and growth expectations. Consolidation doesn't necessarily mean the rally has failed.
Weak deal bookings, disappointing revenue guidance, AI-related disruption of traditional services, or rising global risk aversion could trigger a renewed decline. Wipro's soft bookings show why the recovery shouldn't be read as proof that every IT company is back to strong growth.
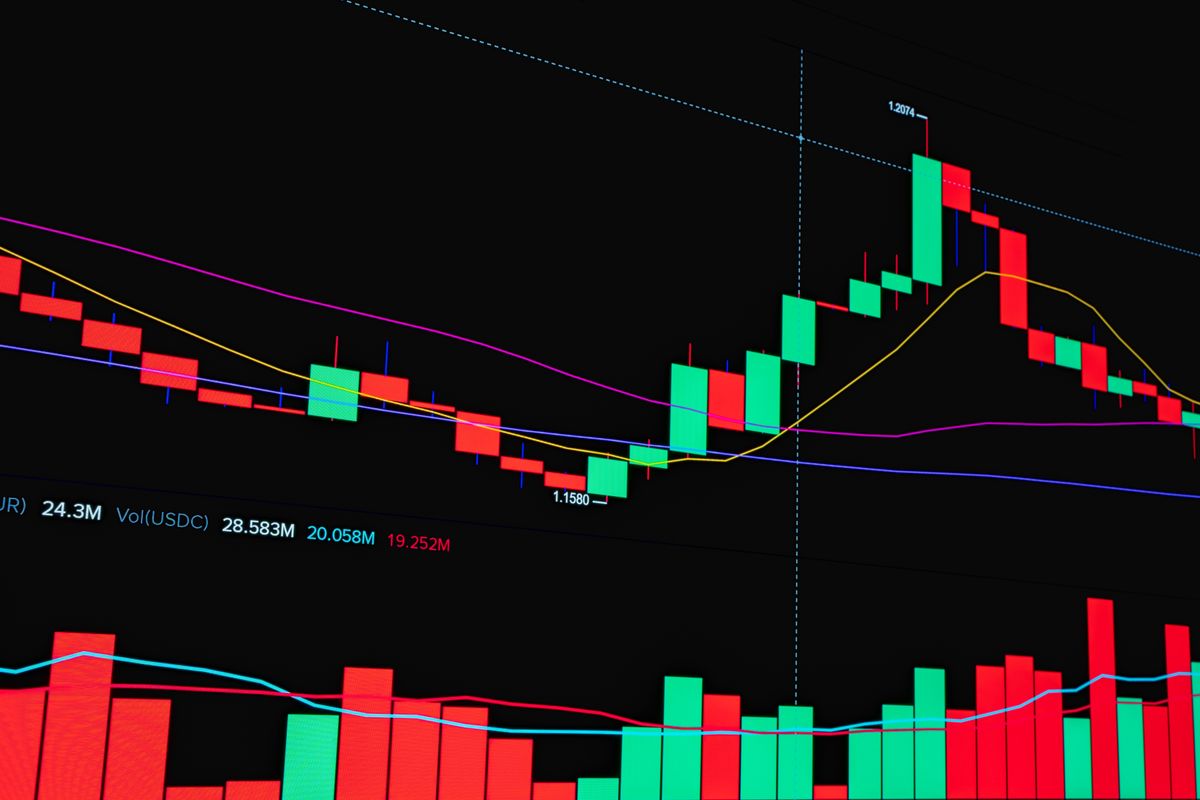
Higher highs, higher lows and volume confirmation make a rally more convincing.
4. What Should Retail Investors and Traders Do?
The right approach depends on whether you're investing or trading.
For long-term investors
| For swing & intraday traders
|
Learn the technical tools behind these decisions in the Nifty Bazar Stock Market Course, and read How to Read Candlestick Charts Like a Professional Trader to spot reversals and continuations. For the bigger market backdrop, see Nifty 50 Outlook 2026 and Why Nifty and Sensex Are Falling.
5. Final Outlook: Is This a New IT Bull Market?
The rally rests on better-than-feared quarterly results, buying in battered stocks and a shift in positioning amid global AI volatility. The Nifty IT index's record-type weekly gain shows how quickly sentiment can flip.
But a sharp price recovery and a sustained business recovery are two different things. For a durable uptrend, investors need continued earnings improvement, stronger deal pipelines, better revenue visibility and proof that AI investments generate profitable business.
Key takeaway: the IT sector has rebounded sharply, but stock selection, valuation and risk management remain essential. Watch the next earnings round and price confirmation rather than assuming a straight-line rise.
Candlestick patterns, support & resistance, RSI, EMA, volume and risk management — taught through practical chart examples in the Nifty Bazar Technical Analysis Course (66 lessons).
Explore the Course
Disclaimer: This article is for educational purposes only and is not a recommendation to buy or sell any stock. Stock market investments involve risk, and future price movements cannot be guaranteed.

BAPI SASMAL
More from BAPI SASMAL

Gold Price Forecast ...
8 Sep 2026
Indian Stock Market Today: Why ...
10 Sep 2026
Master candlestick patterns to ...
27 Jul 2026Comments
Learn Market Earn Money


Additional Links
Login Register Contact About Disclaimer Privacy Policy Terms Conditions Refund PolicyContact US


Reply to Comment